What should I check first in my POS reports?
To check the POS reports, start with sales first and check them by hour. It shows your slow and busy times, so you can adjust staffing and run deals. Then add food and labor costs next.
POS systems
Updated On: November 02, 2026 | Published On: November 02, 2026 |

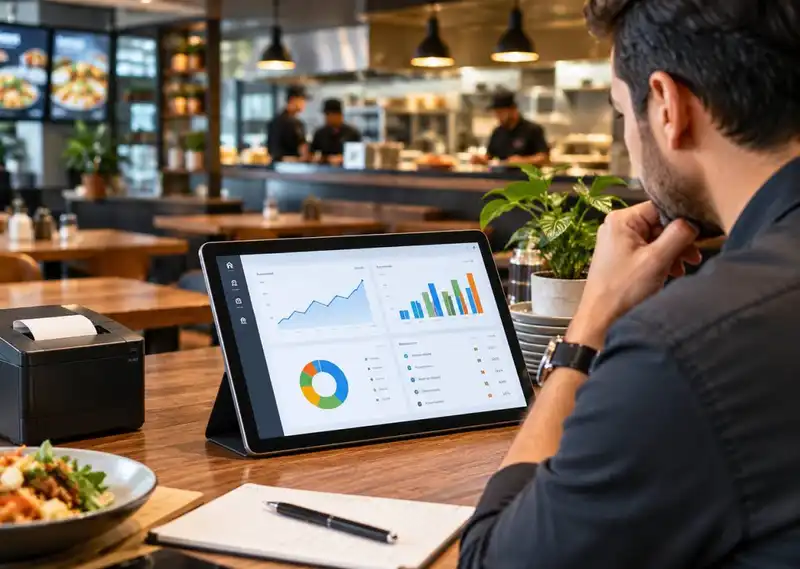
To check the POS reports, start with sales first and check them by hour. It shows your slow and busy times, so you can adjust staffing and run deals. Then add food and labor costs next.
Every day, your POS system collects thousands of data points. Most restaurant owners only look at daily sales, which leaves a lot of valuable information unused. The right reports can show which menu items make you the most profit, when labor costs spike, where your inventory disappears, and what keeps guests coming back. That is where restaurant reporting turns from a chore into a real advantage.
The good news is that you don't need a big budget or a data team to use it. Your POS already captures orders, payments, deliveries, and guest activity all day long. This guide shows you which numbers to watch, how to start, and how to use them to compete with larger, well-funded restaurants.
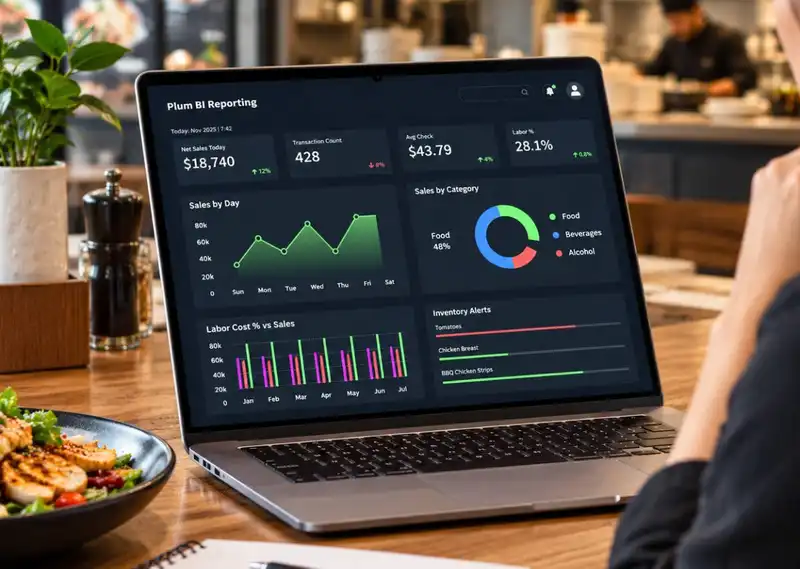

POS analytics reports take the raw data from your system and organize it so you can see what is working and what is not. Most restaurants rely on four main types-
Restaurants run on thin margins. Industry sources commonly put average restaurant profit margins at roughly 3% to 5%. At that level, one bad purchasing week or one overstaffed shift can wipe out your profit. Analytics gives you early warning before small problems become expensive ones.
Here is what that looks like in real life-
Better guest experience- Say your POS reports show that 40% of Friday dinner guests order margaritas. You can offer a premium margarita upgrade or a margarita-and-appetizer bundle during those hours. Guests get something they already want, and your average ticket goes up.
Smoother operations- If your reports show that Tuesday lunch is always slow but you schedule the same crew as Friday, you can trim two shifts and move that labor to your weekend rush.
Higher profit- When you see which dishes sell often but earn little, you can adjust the price, change the portion, or swap an ingredient. Small changes on popular items add up fast.
It is easy to get confused in data. Start with these KPIs, which have a direct impact on your bottom line.
Food cost Percentage- The share of your sales spent on ingredients. Many restaurants aim for about 28% to 35%. If yours creeps higher, something is off in portions, pricing, waste, or theft.
Labor cost Percentage- Labor usually takes up about 25% to 35% of revenue. Track it by day and by shift, not just by month.
Prime cost- Food cost plus labor cost. Many operators try to keep this near 60% to 65% of sales. It is one of the best single health checks for your restaurant.
Average ticket size- Total sales divided by the number of checks. Raising this even by a dollar can make a big difference over a month.
Sales by hour and by category- These show when guests come in and what they buy. Use them to plan staffing, prep, and promotions.
Table turnover- How fast you seat, serve, and clear tables. Faster turns during rush hours mean more revenue from the same dining room.
Void and discount reports- Frequent voids or heavy discounts can point to training gaps, order errors, or misuse. Check these weekly.
Inventory variance- The gap between what you should have used and what you actually used. A large gap usually means waste, over-portioning, or missing stock.
Repeat customers- The share of guests who come back. It tells you whether your service and food are building loyalty.

POS reports are useful, but they are limited. They might tell you what happened- you sold $4,200 on Saturday, and 85 burgers went out. What they don't tell you is why sales dipped after 8 p.m., which items are destroying your margin, or how many staff you will need next weekend.
Advanced analytics fills that gap. It connects your sales, inventory, and labor numbers, then points out patterns and suggests next steps. Research suggests that companies that rely heavily on data are about three times more likely to report better decision-making. For small restaurants, the benefits of POS analytics for restaurants come down to this- you spend less time guessing and more time acting.
| What you want to know | Basic POS data | Advanced POS analytics |
| Sales | Total sales for the day | Sales by hour, category, server, and trend over time |
| Menu | List of items sold | Which items are popular and profitable (menu engineering) |
| Labor | Hours worked | Labor % against sales, by shift |
| Inventory | Stock counts | Usage, waste, and variance, with reorder alerts |
| Guests | Number of checks | Visit habits, favorite items, and repeat rates |
| Planning | Looks back only | Forecasts demand for coming days and weeks |
You don't have to do all of this in one week. Take it one step at a time.
Pick one that tracks sales, inventory, and your regular guests. Your staff should be able to learn it in a day or two. It should also connect with the things you already use, like online ordering and payroll. If it's hard to use, nobody will open the reports.
Your system probably has a dashboard already. Set it so sales, labor cost, and top items show up first when you log in. The restaurant POS reporting built into your system will do most of the work, so you don't need a spreadsheet on the side.
A report doesn't help if nobody knows what to do with it. Go through the main numbers with your managers and give them a simple rule. If labor cost is over your target by 2 p.m., send one person home.
Look at sales by hour and inventory first. When you're used to those, add labor and menu reports. Forecasting can wait until later.
For Example- One cafe owner only watched sales by hour for two weeks. She found out that 2 p.m. to 4 p.m. was nearly dead. She put out a coffee and pastry deal for that window, and those hours now bring in real money. All it took was one report.
Plum POS records every order your restaurant takes and shows you the numbers in plain reports. Here are seven ways owners use them. This is also where the benefits of POS analytics for restaurants start to show.
Plum POS remembers what each guest orders and how often they come in. If someone gets an iced latte every Monday, send her an offer for a free pastry with it. She'll notice you paid attention, and she'll probably keep coming.
Your best seller might not be your best earner. The reports show what each dish sells and what it costs you to make. If your pasta sells great but the ingredients are expensive, raise the price 50 cents or cut the portion a little. Dishes that don't sell and don't earn can come off the menu.
Check sales by time of day to find the dead spots. If weekday afternoons are slow, try a happy hour, a to-go lunch deal, or a catering offer for the offices nearby. After a couple of weeks, look at the report and see if sales went up.
Here is how POS reporting improves restaurant decisions in a very real way. Maybe your reports show too many people on Monday night and not enough on Friday from 6 p.m. to 8 p.m. Move a few hours from Monday to Friday. Guests get faster service when it's busy, and you stop paying for people with nothing to do. Labor is one of your highest costs, so small changes add up.
Restaurants waste about 4% to 10% of the food they buy. That's money in the trash. Restaurant POS reporting shows what sells and what doesn't, so you can order only what you need. If the seafood special sells six plates a week, cut that order in half. No more paying for fish that goes bad.
Your sales data shows habits you may not have noticed. Maybe people who order one appetizer often order dessert too. Offer both together for one price. Maybe delivery jumps when it rains. Run a rainy-day special. Test one thing at a time, then check the report to see if it worked.
The reports show how long orders take and when tickets pile up. If wait times jump every Saturday at 7 p.m., something is off. It might be the kitchen layout, a prep step that gets skipped, or one person too few on the line. Once you know when it happens, it's easier to figure out why.
It can feel like a lot at first. Break it into four steps, and it becomes easy to manage.
Pick a system that fits how your restaurant actually runs. Look for built-in inventory management, sales tracking, and guest data collection. It should be easy for your staff to use and connect with the other tools you already use, like online ordering and payroll.
Use the dashboards, charts, and alerts that come with your restaurant POS reporting tools. Seeing your numbers in a simple visual is much easier than reading long spreadsheets.
A report is only helpful if people know what to do with it. Show your managers how to read the key numbers and what action to take. For example, if labor percentage goes above your target by 2 p.m., the manager can send one person home early.
Begin with sales trends and inventory. Once that feels comfortable, add labor reports, then move on to forecasting and guest analysis.
For example- A neighborhood cafe starts by tracking only sales by hour. Within two weeks, the owner sees that 2 p.m. to 4 p.m. is almost empty. She tried testing a deal during the afternoon; the deal is about coffee and pastry, and those hours go from the slowest day to a steady flow, earning some extra sales. One simple report led to one smart move.
Plum POS takes the numbers your restaurant creates every day and turns them into clear insights. Here are seven practical ways it helps, and where the benefits of POS analytics for restaurants show up first.
Plum POS tracks order history and visit patterns, so you know what your regulars like. Imagine a guest who orders the same iced latte every Monday. With that information, you can send a "free pastry with your Monday latte" offer and make the visit feel personal. This kind of data also supports loyalty programs that bring guests back more often.
Your best sellers are not always your best earners. Plum POS shows which items sell well and which ones have the strongest margins. If a popular pasta dish earns very little because of its ingredient cost, you can raise the price by 50 cents or reduce the portion slightly. Items that sell poorly and earn little can be reworked or removed.
Sales by time of day show you where demand drops. If weekday afternoons are slow, you could test a happy hour, a lunch-to-go deal, or a catering special for local offices. Then check the reports to see if it worked. Slow hours stop being a frustration and become a chance to grow.
This is where the question of how POS reporting improves restaurant decisions gets very practical. If your reports show that you are overstaffed on Monday nights but short-handed on Friday from 6 p.m. to 8 p.m. You can move hours from one shift to the other. Service improves during the rush, and you stop paying for idle time. Because labor is one of your highest costs, even small scheduling fixes can add up to real savings each month.
Restaurants commonly throw away an estimated 4% to 10% of the food they buy before it ever reaches a guest. That is money going straight into the trash. Restaurant POS reporting helps you see what sells and what doesn't, so you can order the right amounts. For example, if a seafood special sells only six plates a week, you can cut the order in half and stop paying for fish that spoils. When your item-level sales are tied to inventory, you also spot over-portioning and missing stock faster.
Your data can show you buying patterns you did not notice before. Maybe guests who order a certain appetizer almost always add dessert. You could bundle them at a set price. Maybe delivery orders spike on rainy days. You could run a rainy-day promotion. Try one new idea at a time and use your reports to see what it earns.
Reports on order flow and service times can reveal bottlenecks. If ticket times jump every Saturday at 7 p.m., the problem might be the kitchen layout, a missing prep step, or too few people on the line. Once you can see the pattern, you can fix it.
Waiting until the end of the week or month to look at your numbers is often too late. Real-time reporting lets you track performance as it happens, and this is another example of how POS reporting improves restaurant decisions during a busy shift. With live data, you can-
Technology keeps moving, and POS analytics is moving with it. Here is what is becoming more common-
Gathering the data is only half of it. The value is in acting on it. Watch out for these common mistakes
Just total sales- High sales can mask low profit. Check margins, prime cost, table turnover, and average ticket size too.
Not often checking reports- Restaurant POS reporting is best used with frequent checks. If you only look at your numbers at the end of the month, a problem like rising food cost may have been hurting you for weeks. A quick weekly review and a short daily check keep you ahead of problems.
Keeping data in separate silos- Sales, inventory, and labor often live in different reports. When you look at them together, you can see the full story of what drives your profit. Good restaurant reporting brings these pieces together in one place.
Ignoring guest data- If you do not track what guests order and how often they return, you miss easy chances to run loyalty offers and personal promotions.
Every transaction tells a story. Restaurants that use POS analytics uncover opportunities to increase revenue, reduce waste, and improve customer satisfaction. The sooner you start using data instead of instinct, the faster you can build a more profitable operation.
Restaurant analytics works best in small steps, so you don't have to change everything at once. Pick one report this week, such as sales by hour or food cost percentage, and use it to make one decision. Then do it again next week. With Plum POS reporting and analytics, those small, steady moves add up to a stronger, more profitable restaurant. Ready to see what your numbers are saying? Book a demo with Plum POS today and start turning every order into a smarter decision.

































Most owners rely on sales, menu performance, inventory, labor, and customer reports. If you are just getting started, begin with sales by hour and menu performance. Add food cost percentage, labor cost percentage, and prime cost as soon as you are comfortable.
Yes. When you can see which items sell and which ones don't, you can order more accurately. You stop buying large amounts for dishes that rarely sell and catch slow movers before they spoil. This is one of the clearest benefits of POS analytics for restaurants, because the savings show up quickly.
Absolutely. Small restaurants have less room for error, so each decision counts more. Strong restaurant analytics shows you what your guests want, where your money goes, and where you can tighten up. You don't need a big operation to benefit from smarter, data-backed choices.
Owners make hundreds of choices, such as what to charge, how many people to schedule, and which dishes to keep. POS analytics replaces guesswork with facts. You can see which dishes guests keep ordering, when sales slow down, and where you are over-ordering.
POS reporting is the way your point-of-sale system turns daily activity into easy-to-read reports. Your POS does more than take payments. It tracks what is selling, when you are busiest, how inventory is moving, and how your team is performing.
2026-11-02
Read More