How can POS analytics help restaurants prepare for NFL season?
POS analytics help restaurants identify top-selling items, forecast demand, schedule staff, manage inventory, and make faster game-day decisions using real sales data.
Restaurant management
Updated On: September 04, 2026 | Published On: September 04, 2026 |

POS analytics help restaurants identify top-selling items, forecast demand, schedule staff, manage inventory, and make faster game-day decisions using real sales data.
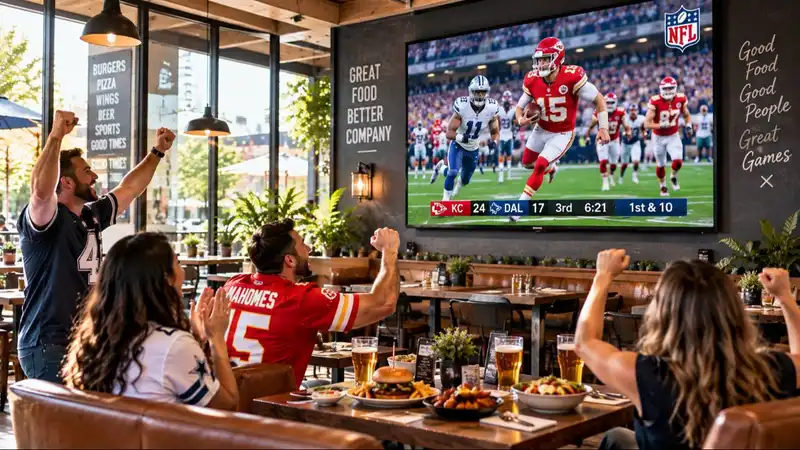
Kickoff for the 2026 NFL season is September 9, and for restaurant operators, that date should be circled in red before it's circled on any fan's calendar. Football season isn't a nice bonus for the industry; it's one of the most predictable, highest-volume stretches on the entire calendar. Sports bars regularly see 20 to 30 percent higher sales on NFL Sundays compared to non-football Sundays. In cities with a passionate fan base, like Green Bay, restaurant food sales jump 27 percent and alcohol sales can spike well over 100 percent on game days.
The problem is that most restaurants treat every Sunday the same. They staff the same, order the same, and prep the same in September as they do in June. Then they get slammed at 11 a.m. before kickoff, run out of wings by the third quarter, and watch tables sit for twenty extra minutes because nobody planned for the rush. The restaurants that actually win football season aren't the ones with the most TVs. They're the ones using restaurant POS analytics to know exactly what's coming before it happens.
This blog walks through the NFL season restaurant tips that actually matter, from menu planning to staffing to real-time game-day decisions, so you're not guessing your way through eighteen weeks of the year's most profitable traffic. Along the way, we'll show exactly how to read your reports so football season restaurant sales become predictable instead of chaotic.
Football season isn't just "busier." It behaves in specific, measurable ways that a generic promotions calendar won't capture.
Sales patterns shift earlier in the day. Data from the first NFL Sunday of a recent season showed morning sales climbing well before kickoff, with a noticeable bump between 9 a.m. and noon as fans grab breakfast or brunch ahead of the game. If your restaurant only preps for a typical lunch rush, you're already behind by 11 a.m.
Menu preferences shift too. Chicken wing orders jump roughly 25% on NFL Sundays compared to the rest of the year, while items like seafood, enchiladas, and fajitas actually decline by a similar margin. Hard seltzer orders climb by nearly 50%. Fans aren't ordering their usual; they're ordering game-day food, and if your kitchen isn't stocked and staffed for that shift, you'll either run out or over-prep the wrong items.
And it's not one big day; it's eighteen-plus weeks of recurring volume, each with its own quirks. Early kickoffs versus late games change your rush windows. Home games versus away games change foot traffic differently depending on whether your restaurant is near a stadium or just has good TVs. Rivalry weekends and playoff pushes create spikes that a flat, "football season is busy" mentality will completely miss.
This is exactly why football season restaurant sales reward operators who plan with real numbers instead of instinct. The restaurants leaving money on the table aren't lazy; they just don't have visibility into what actually happened last season, hour by hour, item by item.

A modern restaurant POS system isn't just a way to ring up orders and close tabs. Every transaction it processes is a data point- what was ordered, when, by whom, how it was paid for, how long the table sat, and whether staffing matched demand at that moment.
Good restaurant POS analytics turn that raw transaction data into decisions-
Step 1- Mine Last Season's Data Before Preseason Ends
Preseason games start in early August, giving you a few weeks of runway before the real volume hits on kickoff weekend. Use it.
Pull your POS reports from last September through the playoffs and break them down by-
This is exactly the gap Plum POS is built to close. Instead of digging through disconnected reports the week before kickoff, Plum POS gives operators real-time sales dashboards, hour-by-hour trend data, and labor forecasting tools that turn last season's numbers into this season's staffing and ordering decisions.
For multi-location groups, Plum POS also makes it possible to compare performance across restaurants during the same game, so you can see which location needs extra staff for a Sunday slate and which one is overstocked. Combined with built-in loyalty tracking, it's built to help you go into football season with a plan based on data, not memory.

Football season rewards preparation. The restaurants that treat it as eighteen weeks of predictable, data-backed opportunity rather than eighteen weekends of chaos are the ones that walk away with meaningfully higher revenue, tighter labor costs, and a base of regulars who come back every single Sunday. None of that requires guesswork. It requires actually using the sales, labor, and inventory data your POS system is already collecting.
Start now, while there's still time before kickoff. Pull last season's numbers, rebuild your game-day menu around what your data says actually sells, staff to the hours your reports show matter most, and keep watching the numbers as the season unfolds. Of all the NFL season restaurant tips out there, this is the one that compounds- consistent football season restaurant sales aren't luck; they're the result of restaurant POS analytics turning a chaotic stretch of the calendar into your most profitable football season of the year.









-Benefits-&-POS-Guide-150-90faf61de.webp)
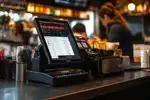



















A POS system tracks exactly when sales spike throughout a game day, down to the hour. That data lets managers schedule staff to match real demand, bringing extra hands in before the pregame rush and keeping the kitchen fully staffed through halftime instead of relying on a generic schedule that doesn't account for football season's unique traffic patterns.
Shareable, fast-turning items dominate football Sundays. Chicken wings typically see the biggest lift, often up around 25 percent compared to non-game Sundays, along with boneless bites, sliders, and other handheld appetizers. Heavier, slower-to-plate dishes like seafood often decline during games, since fans want food that's easy to eat while watching.
It varies by market, but sports bars commonly see sales rise 20 to 30 percent on NFL Sundays compared to non-football Sundays. In cities with especially passionate fan bases, the increase can be much higher; some markets see food sales jump over 25 percent and alcohol sales more than double on game days.
Restaurant POS analytics refers to the sales, labor, and inventory data your point-of-sale system collects from every transaction, turned into usable reports. This includes hourly sales trends, item-level performance, labor cost percentage, table turn times, and repeat customer data, all of which help operators make staffing, menu, and inventory decisions based on actual numbers instead of guesswork.
Start by reviewing last season's sales data to identify your busiest hours, top-selling game-day items, and labor cost patterns. Use that data to rebuild your menu around high-velocity items, adjust staffing to match pregame and halftime rushes, and set inventory par levels for the full eighteen-week season rather than just opening weekend.
2026-10-12
Read More
2026-10-08
Read More